Newsroom
Explore our newsroom for our weekly wreck, press releases, and trending topics.
A Critical Hole in Understanding
Our Premise/ Possible Outcome
Investment returns for both equities and fixed income are driven by prevailing interest rates (and corresponding valuation metrics such as P/E ratios and cap rates). Yet, few investors make a determined effort to understand the drivers of interest rates. Instead, interest rates are treated as something akin to an accident or infection; hard to predict and in the event of a major change, many investors simply bear through it. However, interest rates are critical in determining overall investment outcomes. In fact, prevailing interest rates often have a larger impact on investment returns than any "magic" the most talented private equity firms can typically render. A possible outcome is that inflation continues to ease, interest rates moderate, and valuations slowly recover.
Support
Of all the investment pundits plying the markets, few predicted the massive rise in interest rates over the past 18 months. Forget the "perma-bears" who claim that disaster is always around the corner. Typically, you have a swarm of after-the-fact analysts claiming that it was always in the cards, ignoring the fact that few cogently described likely outcomes beforehand.
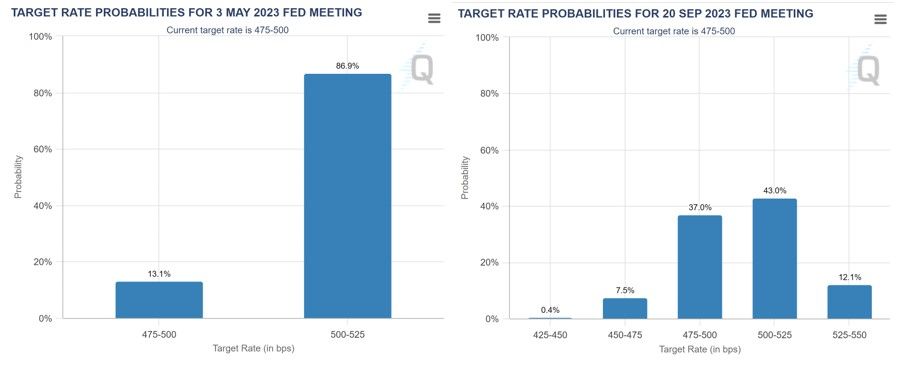
Perhaps the best predictor in the market of future rate hikes is not any one pundit but the market itself. The CME’s FedWatch tool shows that markets predict a modest increase in interest rates on Wednesday, and have mixed views for future meetings.
Figure I: Target Rate Probabilities (May & September, 2023) [2]
Some Humility
While we have demonstrated success in assessing corporate outcomes, endeavoring to predict prospective interest rates is far more difficult, particularly in the long run. In the short run, Milton Friedman (now with his acolyte Professor Steve Hanke) is probably the reigning king, with his view that ultimately inflation and in turn prevailing interest rates are driven by monetary policy. The latest bout of inflation was rendered by the massive increase in money supply (courtesy of QE, helicopter money, and Covid relief), which subsequently prompted Fed Chair Powell to stoke interest rates via a nosebleed rise of 475 bps over a 12-month period. Rate hikes “broke” market participants such as banks due to concerns about the value of credit risk-free assets with long duration, which led to deposit flight.
Okay, so if inflation and in turn interest rates can be predicted by money supply growth exceeding GDP growth, what about longer cycles? Our view is that it becomes trickier, but not impossible.
Historical Perspective: FDR
Probably a good starting point for assessing interest rate cycles domestically is the presidency of FDR. Shortly after taking office in March 1933, FDR declared a nationwide bank moratorium (to prevent a continued run on the banks) and prohibition on banks' paying out or exporting gold. (The bank failures during the Great Depression frightened the public into hoarding gold). Below is a succinct summary:
On April 5, 1933, President Roosevelt ordered all gold coins and gold certificates in denominations of more than $100 turned in for other money. It required all persons to deliver all gold coin, gold bullion, and gold certificates owned by them to the Federal Reserve by May 1 for the set price of $20.67 per ounce. By May 10, the government had taken in $300 million of gold coin and $470 million of gold certificates. Two months later, a joint resolution of Congress abrogated the gold clauses in many public and private obligations that required the debtor to repay the creditor in gold dollars of the same weight and fineness as those borrowed. In 1934, the government price of gold was increased to $35 per ounce, effectively increasing the gold on the Federal Reserve's balance sheets by 69 percent. This increase in assets allowed the Federal Reserve to further inflate the money supply [1].
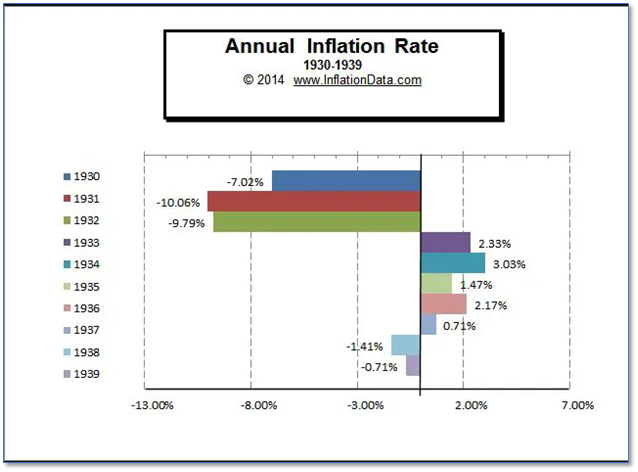
With the increase in money supply, the economy grew, and the Great Depression gradually eased. Below is annual GDP growth information:
Figure II: Annual GDP Growth [3]
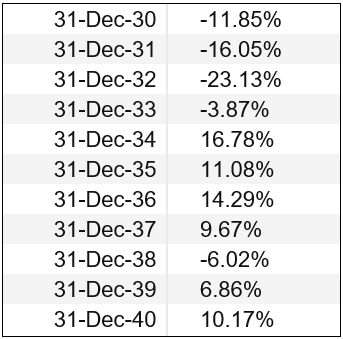
Figure III: Annual Inflation Rate
Historical Perspective: Nixon
President Nixon cut all ties with gold in 1971 when he ended the convertibility of US currency to gold via other countries. The fear at that time was that there were more dollars (convertible into gold at $35 per ounce of gold) than there was gold backing those dollars [4]. The break was made, and money supply was untethered to gold, and the economy grew.
Helicopter Money and Quantitative Easing
Courtesy of the great financial crisis, central banks have newly created powers to fight economic malaise and have even garnered the ability to create new tools, the latest of which is Bank Term Funding Program (BTFP)[5] which was rolled out to address the SVB bank run. The Fed, with the FDIC, also guaranteed all deposits of Silicon Valley Bank and Signature Bank, in the hopes of stemming further deposit flights. However, a major motivator for the reduction in deposits is the fact that most banks pay less than yields available in money markets, thereby pressuring banks to either (a) increase rates on deposits and suffer a decline in net interest margins or (b) jeopardize their deposit base.
Current Conditions and Prospects
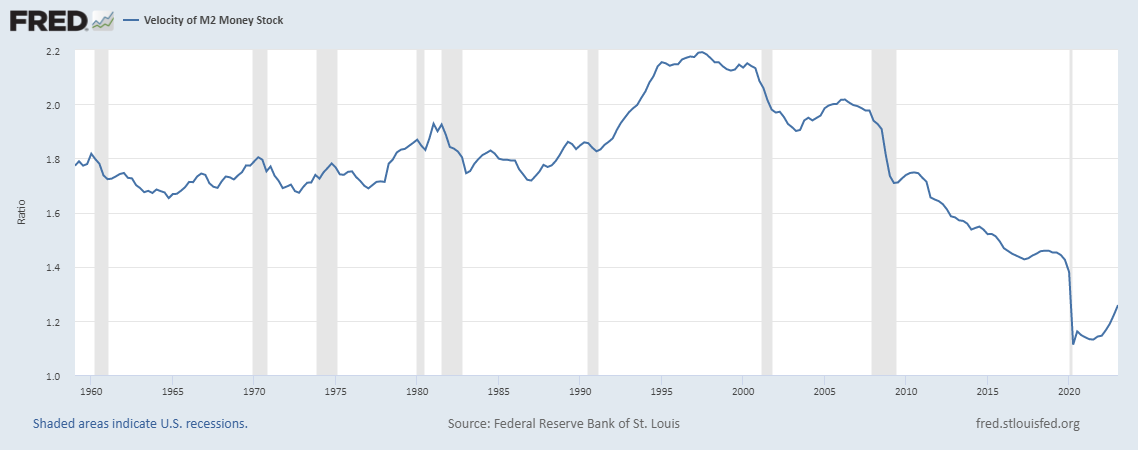
Currently, the money supply is falling at a faster rate than at any time since the 1930s, suggesting a short-term decline in inflation, and presumably, interest rates over time. See the below chart:
Figure IV: Velocity of M2 Money Stock [6]
Professor Steven Hanke of Johns Hopkins University has been fairly accurate in his inflation estimates, basing his predictions on the levels of M2 growth. Per a recent WSJ editorial High Inflation Will End Soon:
“We are lowering our forecast for the year-over-year inflation rate from 5% to between 2% and 5% at the end of 2023” [7]
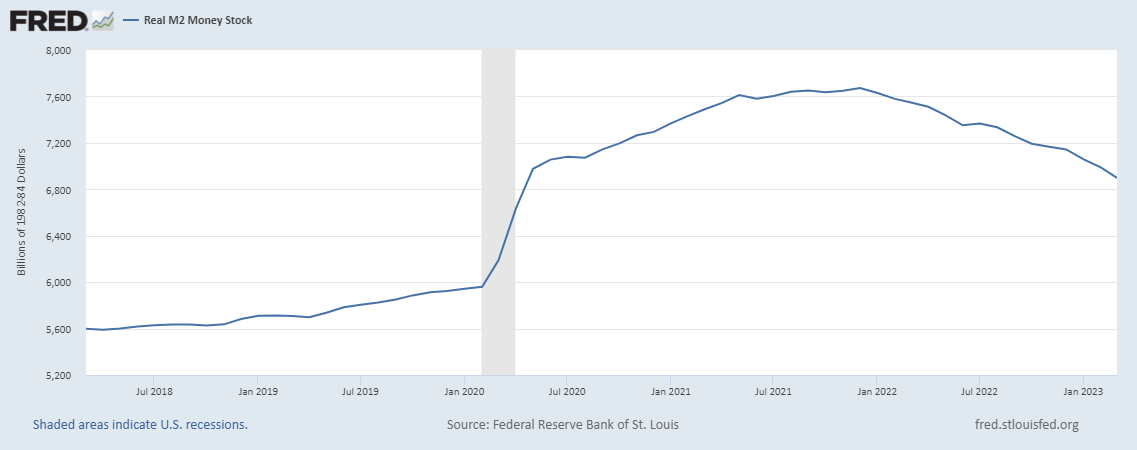
As can be seen below, M2 has declined recently. Time will tell whether the “Inflation Witch” is dead.
Figure V: Real M2 Money Stock
Tied at the hip: 10-year Yield and Inflation
The below chart provides a fairly convincing picture of the correlation between the 10-year yield and money supply (measured in the growth in M2). With the front end of M2 having a greater spread probably as a vestige of Paul Volcker’s massive increase in interest rates to fight inflation.
Figure VI: Market Yield on U.S. Treasury Securities & Trimmed Mean PCE Inflation Rate

Governments’ Current Need
The Debt to GDP ratio of many developed countries is relatively high, historically speaking. Ultimately, there are two or three ways of dealing with the problem: (i) defaults, which is not paying back what was promised, (ii) inflating economies such that investors are repaid in less valuable currencies, (iii) a combination of the two. Our view is that the most palatable solution is the inflation option. If that is the option, then an increase in money supply might be in the cards without a corresponding increase in Fed funds rates. Israel faced a similar situation in the 1980s and successfully navigated it, but in the process introduced a new currency [8&9]. An example of an unsuccessful path was Weimar Germany, which aided the rise of the Nationalist Socialist Party (i.e., NAZI). More recently, Turkey has used an unorthodox approach to fighting inflation which involves a cutting of interest rates, which to date has been unsuccessful. Lastly, Japan, to date has used its central bank balance sheet to manage the shape of its yield curve (and suppress interest rates) which has resulted in a massive rise in the central bank’s balance sheet. Our suspicion is that the unwinding of the holdings will be painful.
Possible Outcomes
Currently, we have a massively inverted yield curve whereby the 10-year treasuries are yielding 3.53% and SOFR (Secured Overnight Financing Rate) is 4.81%. While an inverted yield curve typically is indicative of a pending recession, our view is that if one does occur, it is likely to be short lived and shallow. The more relevant factor is that there is a high likelihood of a normalization of the yield curve with a decline in short term rates. Our suspicion is that inflation will continue to ease (as a result of the decline in M2 growth) and in turn, the Fed will ease interest rate increases.
Simplistic
We recognize that this analysis excludes a variety of factors which might drive inflation, interest rates, and valuation metrics. However, we aim over time to provide some frameworks to assist in understanding some components of critical factors for determining investment outcomes.
____________________________________________
[1] https://www.history.com/this-day-in-history/fdr-takes-united-states-off-gold-standard
[2] https://www.cmegroup.com/markets/interest-rates/cme-fedwatch-tool.html
[3] https://www.multpl.com/us-gdp-growth-rate/table/by-year
[4] https://www.federalreservehistory.org/essays/gold-convertibility-ends
[5] https://www.federalreserve.gov/newsevents/pressreleases/monetary20230312a.htm
[6] https://fred.stlouisfed.org/series/M2V#
[7] Feb. 15, 2023, WSJ
[8]https://press.uchicago.edu/ucp/books/book/chicago/I/bo3637523.html#:~:text=During%20the%20early%201980s%2C%20Israel's,the%20rest%20of%20the%20decade
[9] https://www.imf.org/external/pubs/ft/wp/2000/wp00178.pdf